The story
One thousand decisions, visualized
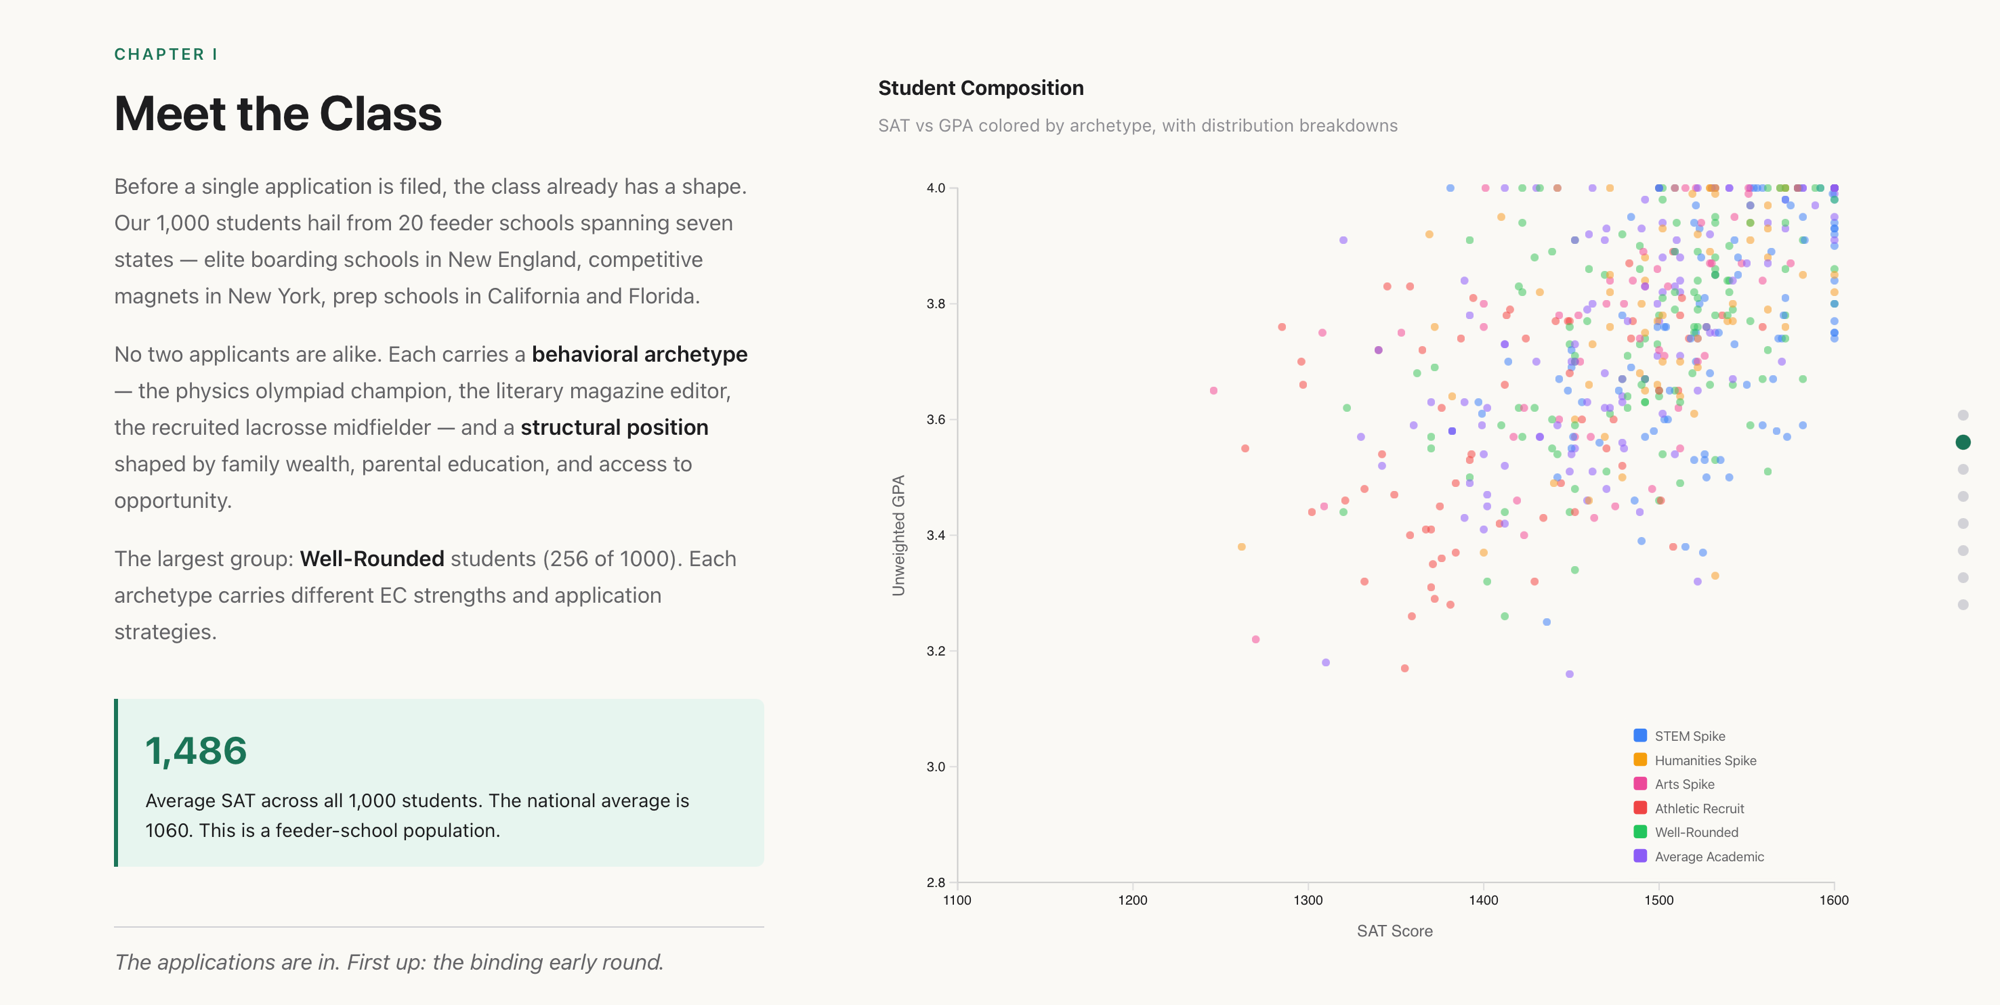
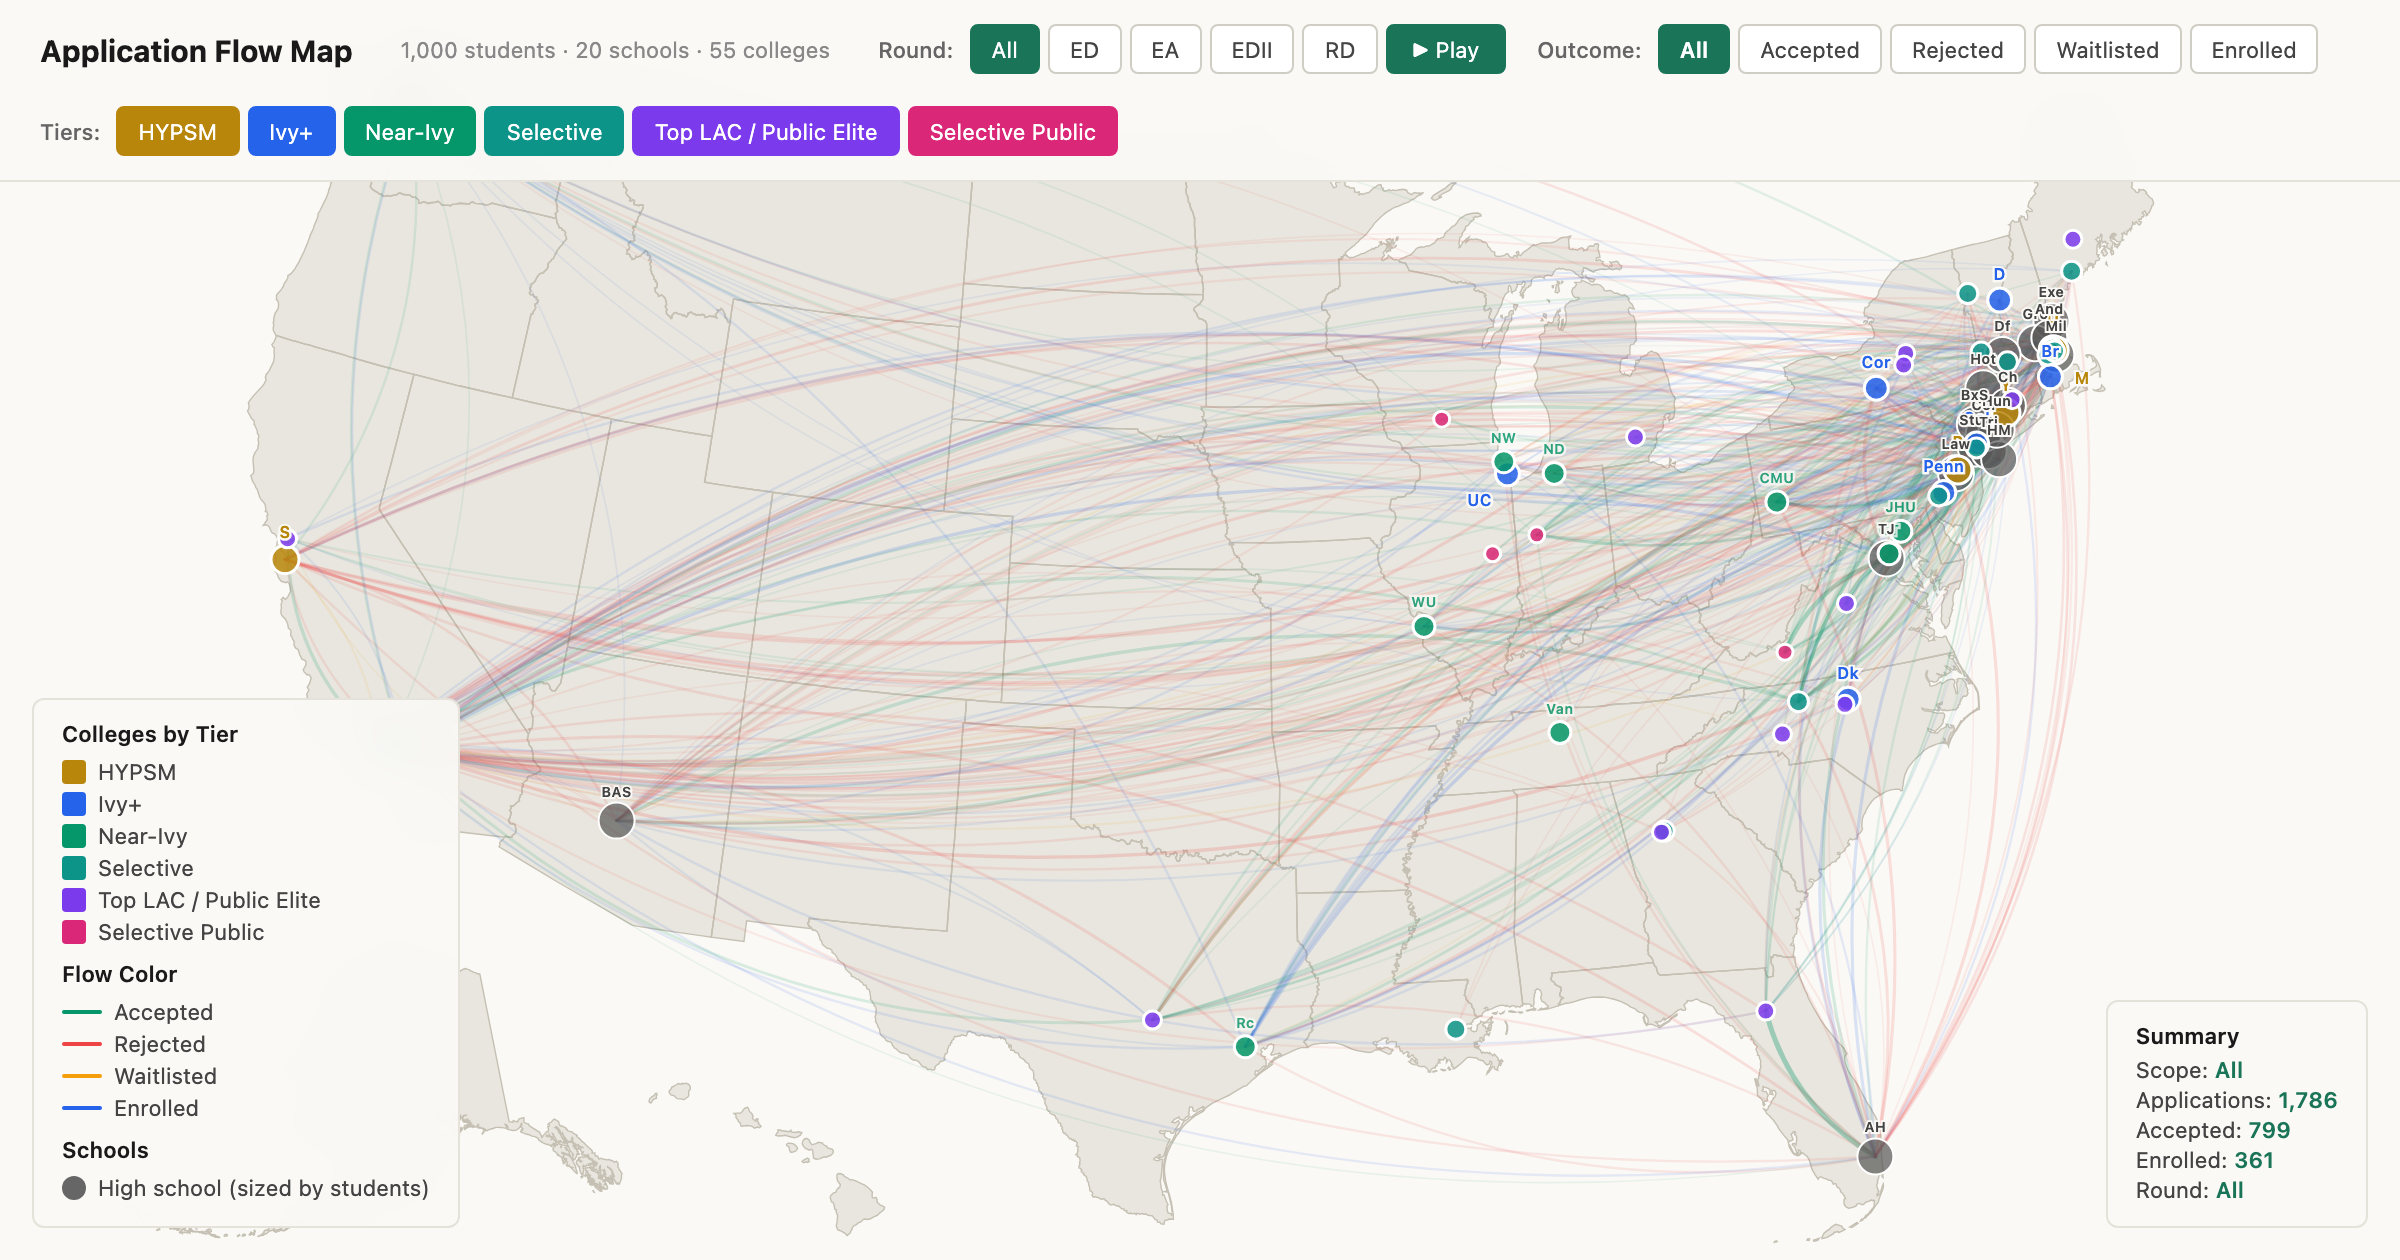
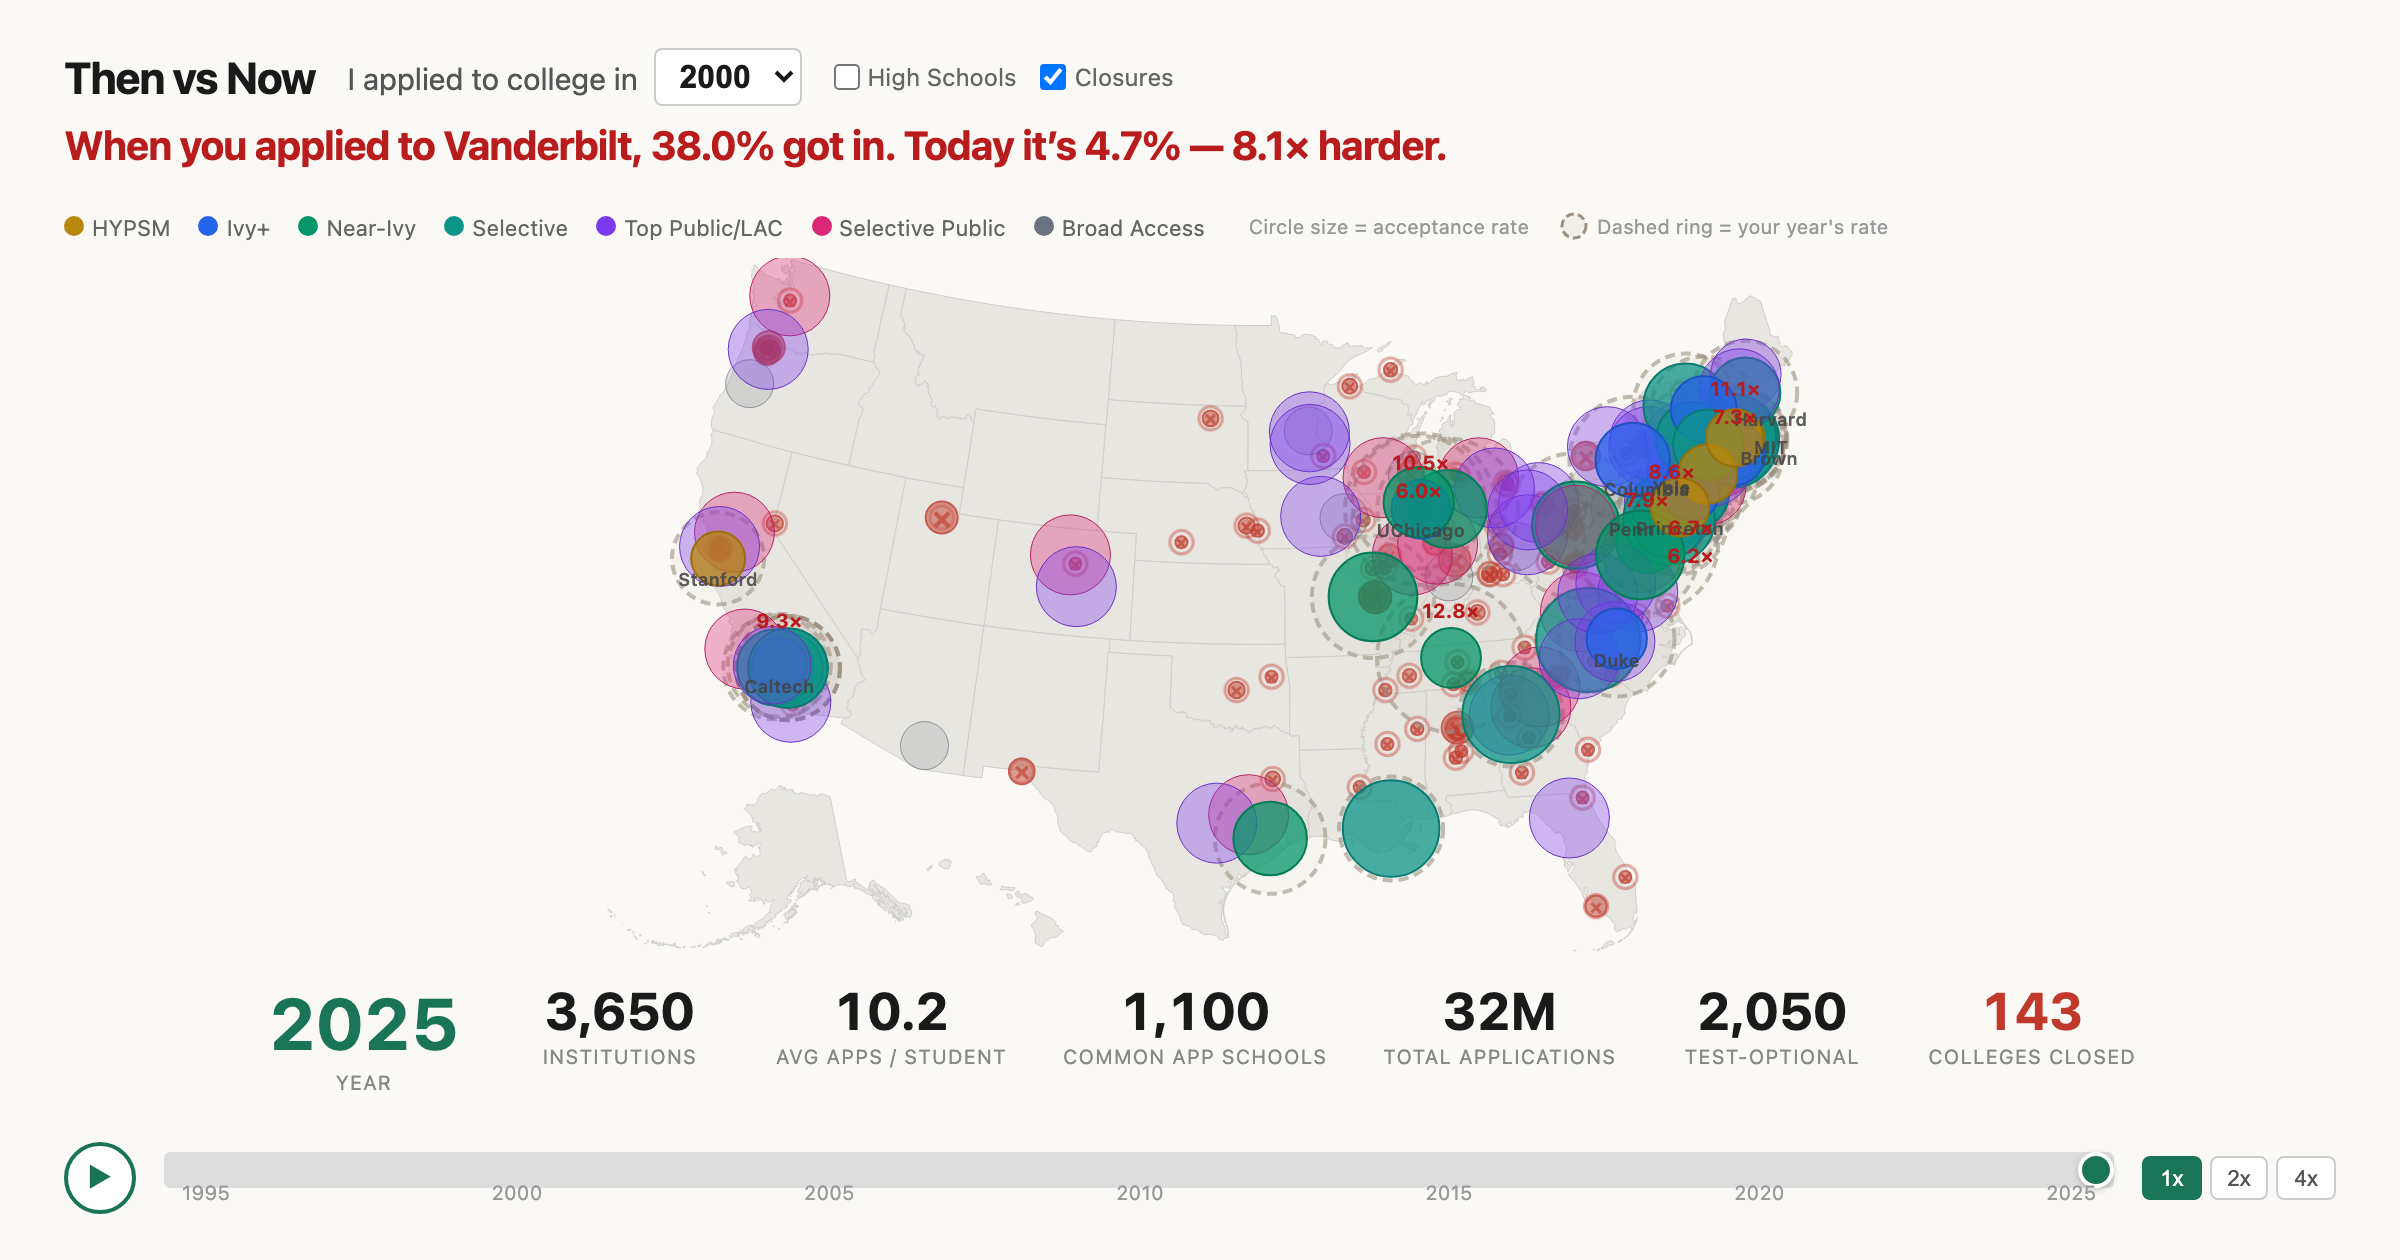
Walk one representative public-school senior class through a full year of admissions — six rounds, from Early Decision to the waitlist. A seven-chapter scrolling narrative showing exactly how 1,200 students sort into 111 colleges, built on real Common Data Set figures. Everyone sees the same run.
Read the story →